| Tree
Form Analysis |
Edward
Frank |
|
Jan
22, 2005 12:30 PST |
ENTS,
Will Blozan's proposed big tree formula is independent of tree
shape
between species. The AF big tree formula and the formula I
suggested
a(height) + b(cbh) + c(crown spread) = Points where a, b, and c
are
constant weighting factors are dependant on tree form. It
strikes me that
an equation of this form could be used to analyze tree shape.
Some trees, such as spruce, tend to be tall with a small canopy
spread.
Others, like Live Oak, tend to have a broad canopy compared to
their
overall height. Other trees fall somewhere in between. The first
step
would be to calculate what the proper weighting factors should
be for each
parameter. A tree of average proportions would be measured. The
factors
of height, cbh, and crown spread would each be weighted so that
all of
these parameters would be equal. These weighting factors,
designated a, b,
and c would then be applied to other trees with differing forms.
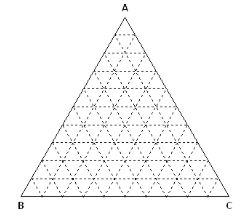
For the base tree the (a)height/total points = 33.3%, the (b)cbh/total
points = 33.3%, and (c)crown spread/total points = 33.3%. On a
ternary
diagram (triangular graph) this generic tree would plot dead
square on the
diagram.
The same weighting factors would then be used to calculate the
total points
for the tree in question. Using the same formulas as above, then
the
weighted values would be calculated as a percentage of the total
points.
These would all plot as a single unique point on the ternary
diagram.
Trees with a broad crown would plot toward the crown apex of the
graph,
tall trees would plot toward the tall apex, fat trees would plot
toward the
girth apex. The form of the tree would be expressed as a list of
these
three percentages.
This format would allow comparisons to be made between trees of
different
forms, between forest versus open grown trees, and similar
analysis. The
advantage is that it uses existing measurements to calculate
these form
parameters and does not require any additional measurements.
Initially some measurements of select trees might need to be
made to
determine what the base "neutral shape" ratios would
be in order to
calculate the weighting factors. But beyond that initial step it
would only
amount to a few cells in a spreadsheet to calculate a form
factor.
I have a small stand alone program that plots ternary diagrams.
I know
that when in school one of the technicians was using Excel to
plot ternary
diagrams. I don't know if this was a base ability of Excel, or
if a
particular macro was used force a ternary diagram. I can check
if someone
is interested. Excel would be a better choice as it should be
able to
import the raw data from the ENTS database.
Ed Frank |
| Re:
Tree Form Analysis |
tpdig-@ysu.edu |
|
Jan
22, 2005 13:31 PST |
Ed,
Definitely... Ternary (triad) graphical data presentation is
well known in
environmental sciences - soil constituents (is it
sand/silt/clay?) and aquatic
sediment health (chemistry/toxicity testing/health of biota in
situ) are just
two examples. Tree forms would be evident, just as soil types
are, by such an
analysis.
Tom
|
| Re:
Tree Form Analysis |
Edward
Frank |
| Jan
30, 2005 18:58 PST |
ENTS,
I have been thinking about this problem: How to calculate what
the average
dimensions of a typical tree would be in order to determine the
weighing
factors? The other question is how does the shape of the tree
change over
time as the tree grows taller and matures?
We can't simply average the crown spread, height, and girth of
the trees in
our dataset (this is something I ask Bob about), because our
trees
measurements are dominated by lots of some trees - white pine -
and few
examples of many others. So averaging the numbers would produce
a value,
but that value would produce something closer to the typical
white pine
shape than the shape of an average tree.
The other consideration is how the shape changes as the trees
grow larger.
We are generally looking at the tallest trees when me measure
them, so if
the form varies, we should calibrate our weighting numbers for
the larger
trees. It is like calibrating a pH meter. If you are measuring
acid
solutions you calibrate using a pH 4 buffer, so that the
measurements will
be most accurate in the range you are measuring. If we were
looking at the
shape of saplings, or young trees, we would need to calibrate to
determine
appropriate weighing parameters for trees in that size range.
It occurs to me that using a given set of weighing factors, you
could plot
a large number of tree of the same species representing
different ages and
sizes and see if there is a consistent pattern of shape change
over time as
the tree matures. You would need to compare
forest grown with forest
grown instead of mixing open and forest grown on one plot for
this purpose.
How to determine a good weighting factor to characterize an
"average" tree
shape. One possibility would be to take say three to five
examples per
species of a wide variety of trees, including both forest grown
and open
grown if possible, and averaging them together. This would
offset sampling
bias caused by one species being sampled more often than
another.
It doesn't really matter if a particular tree is larger or
smaller than the
average, the same weighting factor would be applied to each
parameter, and
the result calculated as a percentile of the total. Distinct
shape
differences should be seen between species, between open grown
and forest
trees, or between trees of different ages. This is a way to
characterize
tree shape in a mathematical way, rather than simple
description.
Does anyone know how to do a ternary diagram with excel?
Ed Frank
TernPlot
- Excel Ternary Diagram Spreadsheet ternplot.xls
|
|